
Buyer's Guide
Home Inspection in Quebec: What It Costs and When to Do It
The pre-purchase inspection generates more questions than any other step in a purchase. Here are the answers, in …
Buyer's Guide
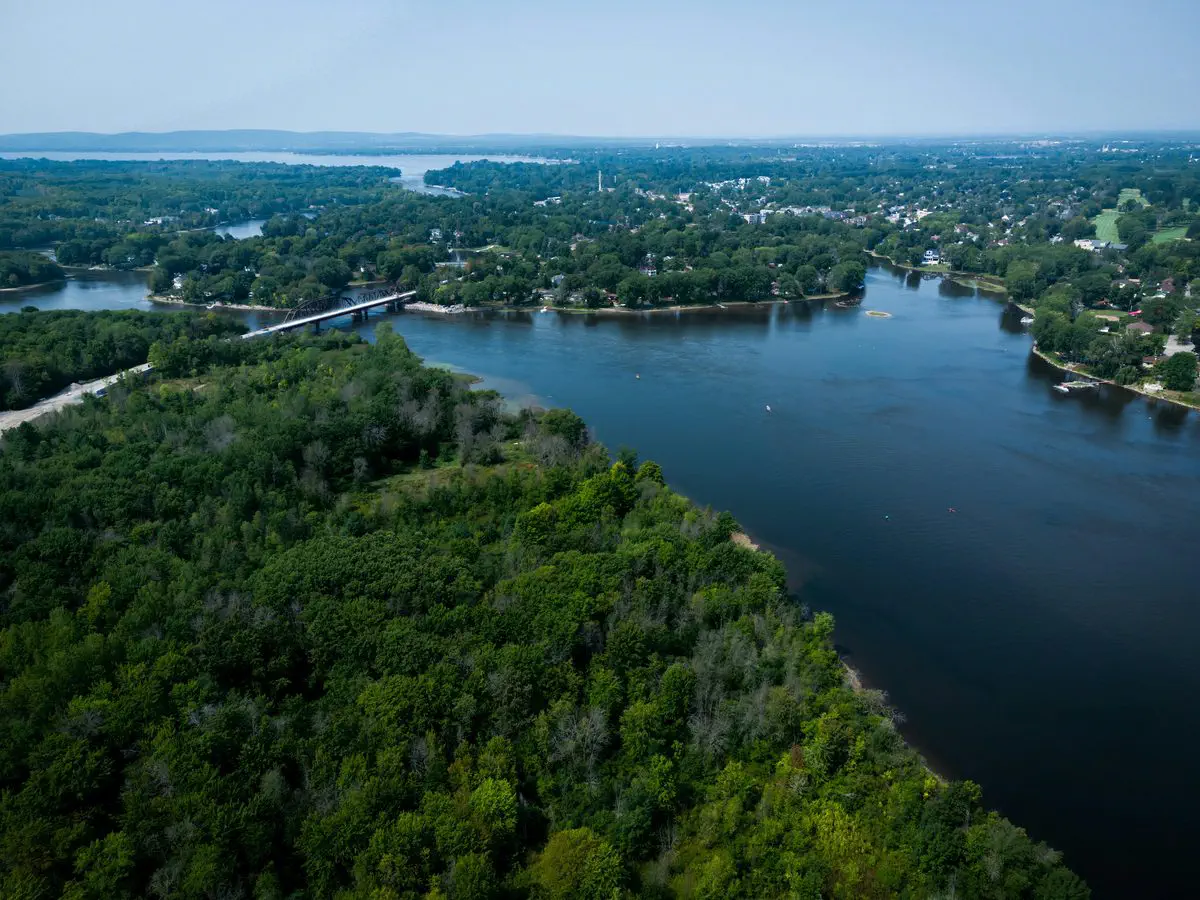
The question I get most often about the North Shore is “which sector is the best one?” I never answer it, and not out of commercial caution: a broker has no business handing out grades to neighbourhoods. What I can do, and what this article does, is give you the comparison grid and the exact address of every official data source, so you can decide for yourself.
Pick two sectors you are hesitating between, open the seven sources below for each of them, and the conversation changes completely.
The Autorité régionale de transport métropolitain divides the region into four fare zones. Laval sits in zone B. The northern crown, which includes Blainville, Boisbriand, Bois-des-Filion, Lorraine, Mascouche, Mirabel, Repentigny, Rosemère, Sainte-Thérèse, Saint-Eustache, Saint-Jérôme and Terrebonne, sits in zone C.
That split has a price. Since July 1, 2026, the All Modes monthly pass at the regular fare costs $110 for zone A, $170 for AB, $206 for ABC and $281 for ABCD. A household with two adults commuting downtown therefore pays $72 more per month from the northern crown than from Laval, or $864 a year. That amount belongs in the housing budget, not the transport budget.
Then check the actual service rather than the map: schedules and frequency for exo train lines 12 Saint-Jérôme and 15 Mascouche on exo.quebec, and, since November 17, 2025, the REM Deux-Montagnes branch, which changed the options available from western Laval and Deux-Montagnes. Then make the trip yourself, on a Tuesday at 7:30 a.m., in both directions.
Every municipality sets its own rate per $100 of assessment, every year, plus its own tariffs for water and waste collection. Those tariffs are often a flat amount per dwelling, which means they weigh proportionally more on a modestly valued property.
Two tax bills cannot be compared head to head, because the two cities' assessment rolls may not share a reference year. Compare the rates published in each city’s budget instead, along with the actual overall tax rate each municipality files with the Ministère des Affaires municipales et de l’Habitation, published in the Profil financier des municipalités locales and on Données Québec. For the mechanics, read how a tax bill is built.
This one works the other way around, and many buyers do not know it. The school tax rate is a single rate for all of Quebec. For 2026-2027 it is $0.07899 per $100 of assessment, with an exemption on the first $25,000 of the assessment of every taxable building. Moving to another city does not change your school tax rate: only the property’s assessment does. Cross that criterion off the list.
For 2026 the provincial scale is 0.5% on the portion up to $62,900, 1% from $62,900.01 to $315,000, and 1.5% above that. But a municipality may adopt a by-law imposing a higher rate on the portion above $500,000, up to 3%, and Montreal is allowed to go higher still. Ask the city for its by-law before you sign. The details are in the welcome tax explained, and the transfer duty calculator does the arithmetic.
The property assessment roll is produced every three years by the municipal body responsible for assessment. It carries owners’ names, the characteristics of the land and the building, their values and the cadastral lot number. Several cities, Laval and Terrebonne among them, publish it online.
The year of construction tells you what to look for before you even visit: aluminum wiring, an oil tank, the type of attic insulation, an original foundation drain. For a picture of a whole sector rather than one address, Statistics Canada’s 2021 Census Profile gives the period of construction of dwellings by municipality. After that, use the first visit checklist and the pre-purchase inspection guide.
A city’s zoning by-law states which uses are permitted in each zone, at what height and at what density. The vacant lot behind the yard and the parking area on the corner are already described in it.
Add the metropolitan layer. The Plan métropolitain d’aménagement et de développement of the Communauté métropolitaine de Montréal identifies 159 TOD areas, drawn as a radius of 0.5 or 1 km around access points of the structuring transit network, and aims to direct at least 60% of new households from 2011 to 2031 into them. The interactive map sits at the Observatoire du Grand Montréal. If your sector appears there, densification is not a rumour, it is a written planning direction.
The Ministère de l’Éducation calculates a socio-economic environment index every year. It combines two census indicators: the share of families with children whose mother holds no diploma, which carries two thirds of the weight, and the share of households whose parents were not employed during the census reference week, for the remaining third. Public schools are then sorted into deciles.
It measures the environment, not the quality of teaching. Treat it as data, never as a ranking. Then verify the catchment area, the boundary that ties a specific address to a specific school: it is set by the centre de services scolaire and it can be revised. Two houses on the same street are not always in the same catchment, and a real estate portal’s map carries no weight on this. Call the centre de services scolaire with the exact address. Quebec.ca’s Trouver un organisme scolaire tool points you to the right one. Also worth reading: schools and property values.
The regulatory framework for water environments has changed: it replaced the transitional regime on March 1, 2026. The Quebec government’s interactive map of flood zones and watercourse mobility zones can be searched by address at zonesinondables.mrnf.gouv.qc.ca. It is indicative: the municipality or the MRC confirms the exact boundary. On the North Shore, any property fronting the rivière des Mille Îles deserves that check every single time.
For soil, the Ministère de l’Environnement’s contaminated sites registry and its Repère GTC mapping tool list the files brought to the ministry’s attention, including sites already rehabilitated. It is not an exhaustive inventory: the absence of a record is not proof of anything. The certificate of location, for its part, flags flood zones and servitudes.
The Quebec Professional Association of Real Estate Brokers publishes monthly statistics drawn from the Centris database, by metropolitan area and by municipality. That is the source to quote, rather than a national average or an automated estimate. My market analysis starts there.
A sector’s reputation gets repeated, not verified, and it usually runs about ten years behind the ground. The opposite method takes one evening per sector: open the assessment roll, the zoning by-law, the flood map, Repère GTC, the ARTM fare grid and the city budget, write down seven answers, keep the source for each one. Add two visits on site, a Tuesday at rush hour and a Saturday morning, and read the agendas of the last few city council meetings, which announce projects before the papers do.
If a number cannot be found anywhere, it does not enter the decision. That is the only rule that genuinely protects a buyer.
Pick two, fill in the same grid for each, and reputation stops being an argument. The sector pages on this site give the local context for Laval, Terrebonne, Mascouche, Blainville, Sainte-Thérèse, Rosemère, Boisbriand, Lorraine, Saint-Eustache, Saint-Jérôme, Mirabel and Repentigny.
Send me the two sectors you cannot decide between. I will fill in the grid with you, sources attached, before your first visit: get in touch.

Residential Real Estate Broker · RE/MAX DU CARTIER INC.
Contact GeorgesThe pre-purchase inspection generates more questions than any other step in a purchase. Here are the answers, in …

Off-market is the most misused phrase in Quebec real estate. It suggests a back door and an insider price. The …
Preparing a property before listing it means two things at once. A presentation job, which everyone knows about. …