
Real Estate 101
Inheriting Property in Quebec
When a house is part of an estate, the heirs’ first question is almost always the same: do we sell? Before …
Real Estate 101
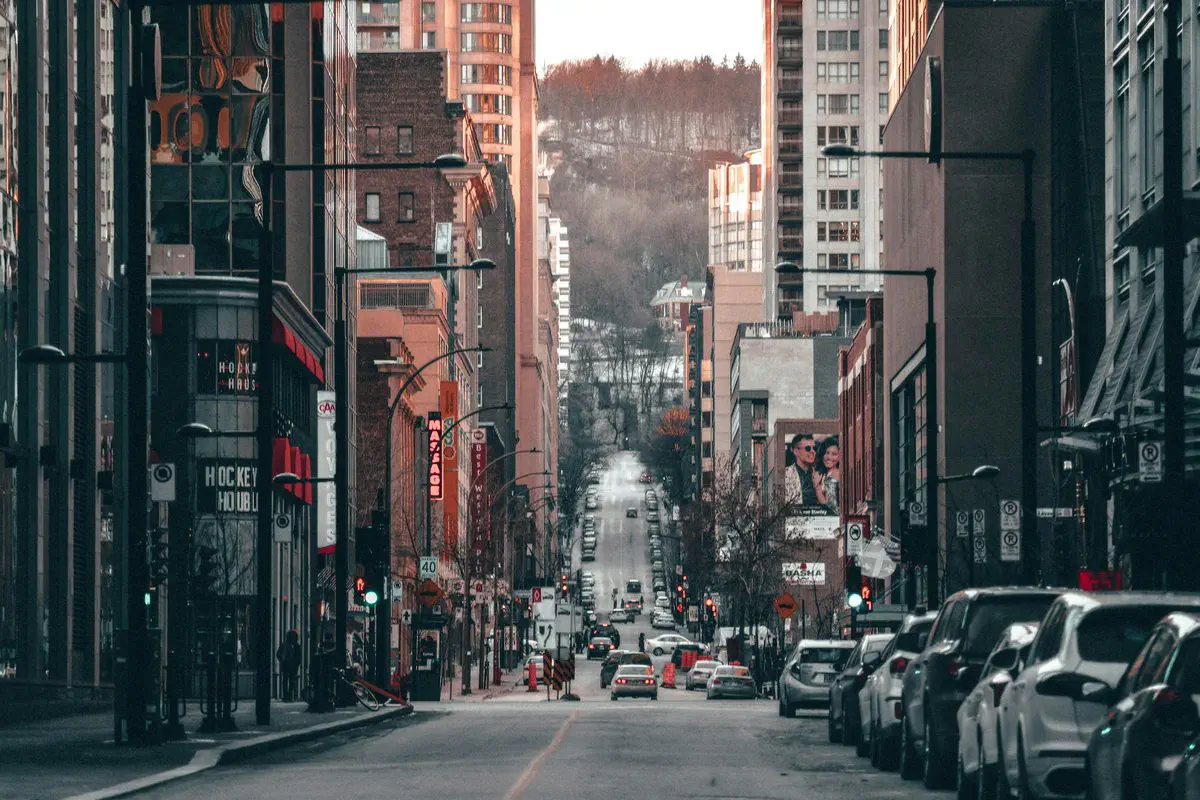
You will not find a list of the five best neighbourhoods in Montreal here. Not because the exercise would be hard, but because it is not a broker’s to make. Declaring that one neighbourhood is better than another is passing judgment on the people who live there, and that ground turns into discrimination very quickly. My job is the opposite: give you verifiable criteria, the official source behind each one, and let you draw the conclusion.
One useful clarification first. A Montreal neighbourhood is not an administrative entity. By-laws, taxes and services follow the boundaries of the 19 boroughs and of the linked cities of the agglomeration. So the first question is not “which neighbourhood?” but “which side of which boundary?”.
In Montreal, tax rates vary according to the category of the building and the borough it sits in. Each borough also levies its own local service and investment taxes, which are added to the taxes adopted by city council. Two properties carrying the same value on the assessment roll, on either side of a street that happens to be a boundary, therefore do not produce the same bill.
The City publishes the full grid every year, under “Taux de taxes”, on montreal.ca. Take the residual residential category rate for the borough you are looking at, not the average quoted in the newspapers. For the mechanics of the calculation, read the tax bill explained.
This is the sharpest gap in Greater Montreal, and it is settled at the notary’s office. The 2026 provincial scale stops at 1.5% above $315,000. A municipality may go up to 3% on the portion above $500,000, except Montreal, which the law allows to go higher.
For 2026 Montreal applies 0.5% up to $62,900, 1% from $62,900 to $315,000, 1.5% from $315,000 to $552,300, 2% from $552,300 to $1,104,700, 2.5% from $1,104,700 to $2,136,500, 3.5% from $2,136,500 to $3,113,000, and 4% above $3,113,000. Crossing a municipal boundary therefore changes your closing costs before it changes your mortgage. Details in the welcome tax explained, and the transfer duty calculator does the arithmetic.
The rate is a single rate for all of Quebec: $0.07899 per $100 of assessment for 2026-2027, with an exemption on the first $25,000 of the assessment of each taxable building. Neither the borough nor the school service centre changes it. That criterion settles nothing.
The entire agglomeration of Montreal sits in zone A of the Autorité régionale de transport métropolitain. Since July 1, 2026, the All Modes A monthly pass at the regular fare costs $110. The price is the same everywhere on the island, so it stops being a point of comparison between neighbourhoods.
What varies is time and reliability. Measure the real walking distance to the station, not the straight line, and make the full trip at rush hour, in both directions. Factor in a network that is still moving: the REM Deux-Montagnes branch has been in service since November 17, 2025, and the Plan métropolitain d’aménagement et de développement of the Communauté métropolitaine de Montréal identifies 159 TOD areas, drawn as a radius of 0.5 or 1 km around access points of the structuring transit network, toward which it aims to direct at least 60% of new households from 2011 to 2031. The interactive map sits at the Observatoire du Grand Montréal.
The property assessment roll, produced every three years by the municipal body responsible for assessment, carries owners’ names, the characteristics of the land and the building, their values and the cadastral lot number. Statistics Canada’s 2021 Census Profile adds the period of construction of dwellings at the scale of a whole sector.
One Montreal-specific data point belongs here: the lead water service line. The City targets buildings of 8 dwellings or fewer built before 1970 and publishes an online map showing, by address, the known state of the water entry, possible lead, confirmed lead or no lead, along with the history of interventions. Check it before the offer, not after.
Add pyrite. The OACIQ documents cases in 91 cities of the Montreal region and identifies the South Shore, eastern Montreal and the West Island as the highest risk zones. A broker has a duty to inform a client when the property sits in one. The rest plays out at the visit and the inspection: first visit checklist and pre-purchase inspection.
Each borough has its own zoning by-law. The grids of uses and standards published through Info-zonage are drawn from it, and the City offers a by-law search service along with open data, including the height limits of the urban plan.
Two concrete questions are settled there. What can be built on the vacant lot behind your yard. And what you will be able to do with your own building: add a dwelling, occupy the commercial ground floor, extend. A project refused at the permit counter is a project that does not exist, whatever the seller implied.
The Ministère de l’Éducation calculates a socio-economic environment index every year, from two census indicators: the share of families with children whose mother holds no diploma, for two thirds of the weight, and the share of households whose parents were not employed during the census reference week, for the remaining third. Public schools are then sorted into deciles.
The index describes the environment, not the quality of teaching. And it says nothing about which school will serve your address: the catchment area is set by the centre de services scolaire and can be revised. Two houses on the same street are not always in the same catchment, and a listing portal’s map carries no weight on this. Call the school service centre with the exact address. Also worth reading: schools and property values.
The regulatory framework for water environments replaced the transitional regime on March 1, 2026. The Quebec government’s interactive map of flood zones and watercourse mobility zones can be searched by address at zonesinondables.mrnf.gouv.qc.ca, and remains indicative: the municipality confirms the exact boundary.
For soil, the Ministère de l’Environnement’s contaminated sites registry and its Repère GTC tool list the files brought to the ministry’s attention, rehabilitated sites included. On an island with a dense industrial past, that check takes three minutes. Keep in mind that the registry is not exhaustive: the absence of a record proves nothing.
The Quebec Professional Association of Real Estate Brokers publishes monthly statistics drawn from the Centris database, by metropolitan area, by municipality and by borough. That is the number to quote. My market analysis starts from that source.
A neighbourhood’s reputation travels fast and never carries a date. The opposite method takes one evening: open the assessment roll, the borough tax grid, the zoning by-law, the lead map, the flood map and Repère GTC, then write down the answer and the source. Add two visits on site, a Tuesday at rush hour and a Saturday morning, and read the borough council agendas.
If a number cannot be found anywhere, it does not enter the decision. That single rule removes most of what people repeat about Montreal neighbourhoods, and what remains is a short, dated, sourced list you can actually act on.
The same grid works beyond the island, between Montreal, Laval, Longueuil, Brossard, Terrebonne and Repentigny.
Give me the two neighbourhoods you are torn between. I will fill in the grid with you, sources attached, before the first visit: get in touch.

Residential Real Estate Broker · RE/MAX DU CARTIER INC.
Contact GeorgesWhen a house is part of an estate, the heirs’ first question is almost always the same: do we sell? Before …

The choice of a banner comes up early in the conversation, and almost always in the wrong place. People compare …

This is one of the most frequent questions among first-time buyers, and no single number can answer it honestly. …